| Line 7: | Line 7: | ||
==Wiki activity snapshots== | ==Wiki activity snapshots== | ||
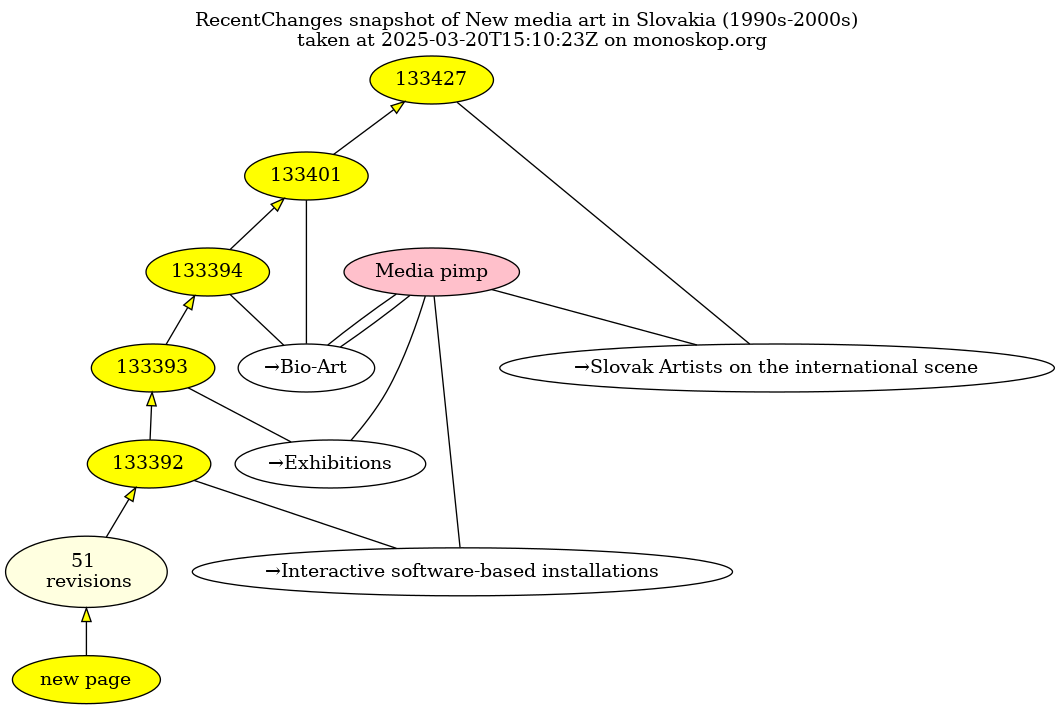
[[File:Revisions-New media art in Slovakia 1990s 2000s.dot.png]] | [[File:Revisions-New media art in Slovakia 1990s 2000s.dot.png|First outcome of our wiki technotext ethnographic trajectory. The graph above was generated with [https://cc.vvvvvvaria.org/~friends/recentchanges.py this script], using Python, Jinja and Graphviz and working with the wiki of monoskop.org.]] | ||
Taking snapshots of a wiki using Graphviz to make layout. | Taking snapshots of a wiki using Graphviz to make layout. | ||
Revision as of 15:33, 21 March 2025
Computational Publishing:
wiki-4-print, Pelican, paged.js, HTML, CSS, web to print production
CC has ideas: MediaWiki, wiki culture and existing/previous wiki printing practices/research + wiki4print as publishing environment
Wiki activity snapshots
Taking snapshots of a wiki using Graphviz to make layout. Graphviz is not easy to control, and that's meant to be so. You can control some things like fontsize and shape of the nodes, but the placement of nodes and edges is controlled by Graphviz.
If you make something for print, or for the web, you think about how long something will last. We tend to then simplify layout, to make it accessible for people for as long as the layout exists. We follow conventions based on our reading direction (left to right, top to bottom in our language). Putting something on the top-left of the page (like a link to a homepage), is a decision that feels very accessible.
But Graphviz follows a different approach. It places the nodes and the edges without thinking about usual hierarchies, or usual ways of reading. We done a bit of that with the title of the graphs. Here the placement at the top is important, it is different information to the content of the graph. But the rest of the layout of the graph is decided upon by Graphviz. And also placed differently once the content of the graph changes. It connects the act of making snapshots and taking a particular slice from the bigger whole in the form of a graph on a particular moment in time.
In this way, it fits a technotext-ethnographic approach. Taking samples at different moments to make layouts. It introduces an element of time and temporality.
Notes from reading from the booklet "16 case stories", published by the LGRU in 2013:
- layout is the spatial arrangement of text and graphical elements
- what we understand of it is directly exported from the Gutenberg press
- there are little traces of the encounter of layout with digital systems
What we notice and remember about wiki-to-print practice: the digital systems that are involved in the making of printed matter often become invisibilized.
